 I'm amazed by the imagery you get on google maps with terrain, images and wikipediaarticles.
I see a hammer I want to use, now to find some nails.
Lets say you work for a news publicist who wants to leverage their articles metadata quality to make navigation and search easier for their customers and researchers and writers.
Tagging with metadata requires that the metadata is applied correctly and in a standardized fashion. Vizualizing the metadata can make the categorization easier and be an incentive for revisiting already tagged metadata and improving it.
Metadata can be vizualized on a timeline or a map. Lets say we want to connect Wikipediaarticles to a map of the world. The articles can be tagged with topics such as country, a city in that country, a person that lives in that city or a car used by that person. The identifiables (country, city) must be either geotagged, or searchable in a database that has information of names of places and latitude / longitude. If amount of work for tagging the articles is to hard, the topics of the text can be extracted by text mining.
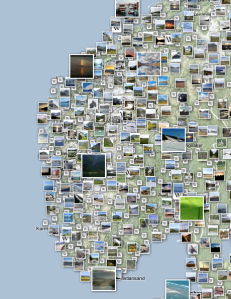
If the articles have a picture related to them, this can be added to the vizualisation, if not, a picture can be added based on topic or nearby location.
The end result is that the researchers and writers get an incentive to improve the metadata because the information is easier to distinguish from one another, whereas the articles with poor metadata will appear in a messy ball, screaming for attention.
The next step is finding out how the google maps API works :)
No comments:
Post a Comment
Spam will be pruned